Turning Complex Acquisition Data into an Effortless Client Experience
How a four-day design sprint turned a challenging 100-slide reporting process into a simple, intuitive data experience that boosted efficiency and strengthened client trust.
Hours of Prep, Slide Decks 80-100 Slides Long, and Incomprehensible Data
Ed Hodges in PGS is responsible for delivering the scoped and contracted data quality to the clients. The challenge he had was that one part of the technical equipment was difficult to monitor in terms of it’s performance. Ed and his team found it difficult and time consuming to explain to the client why and how we were meeting the standards we had agreed on.
The data sat in systems that were hard to access and even harder to interpret, which meant Ed’s team spent hours manually reconstructing the story for the client. They were needing to create slide decks of 80-100 slides long to explain every second of data acquisition. More questions were being asked and more meetings were being held than were necessary, for the client to feel confident in the data. And there was a large time burden in preparing for these meetings with lengthy copy and paste exercises to be able to present the data in a digestible way.
A Dream of Empowered Clients and High Satisfaction Metrics
Ed wanted to find a way to get a better overview of the situation over time and be able to guide the client through the data in an easy to digest way. He dreamt of empowering the client to view and understand without needing to explain every detail. He needed a way to shift conversations from defending the data to easy approval. He wanted to ensure there was no question over the decisions and actions we were taking as a company to provide the client with the data they needed. He needed to reduce the time it took to work on each presentation (or eliminate it) and he wanted to ensure his customer satisfaction metrics reflected the service he and his team were providing.
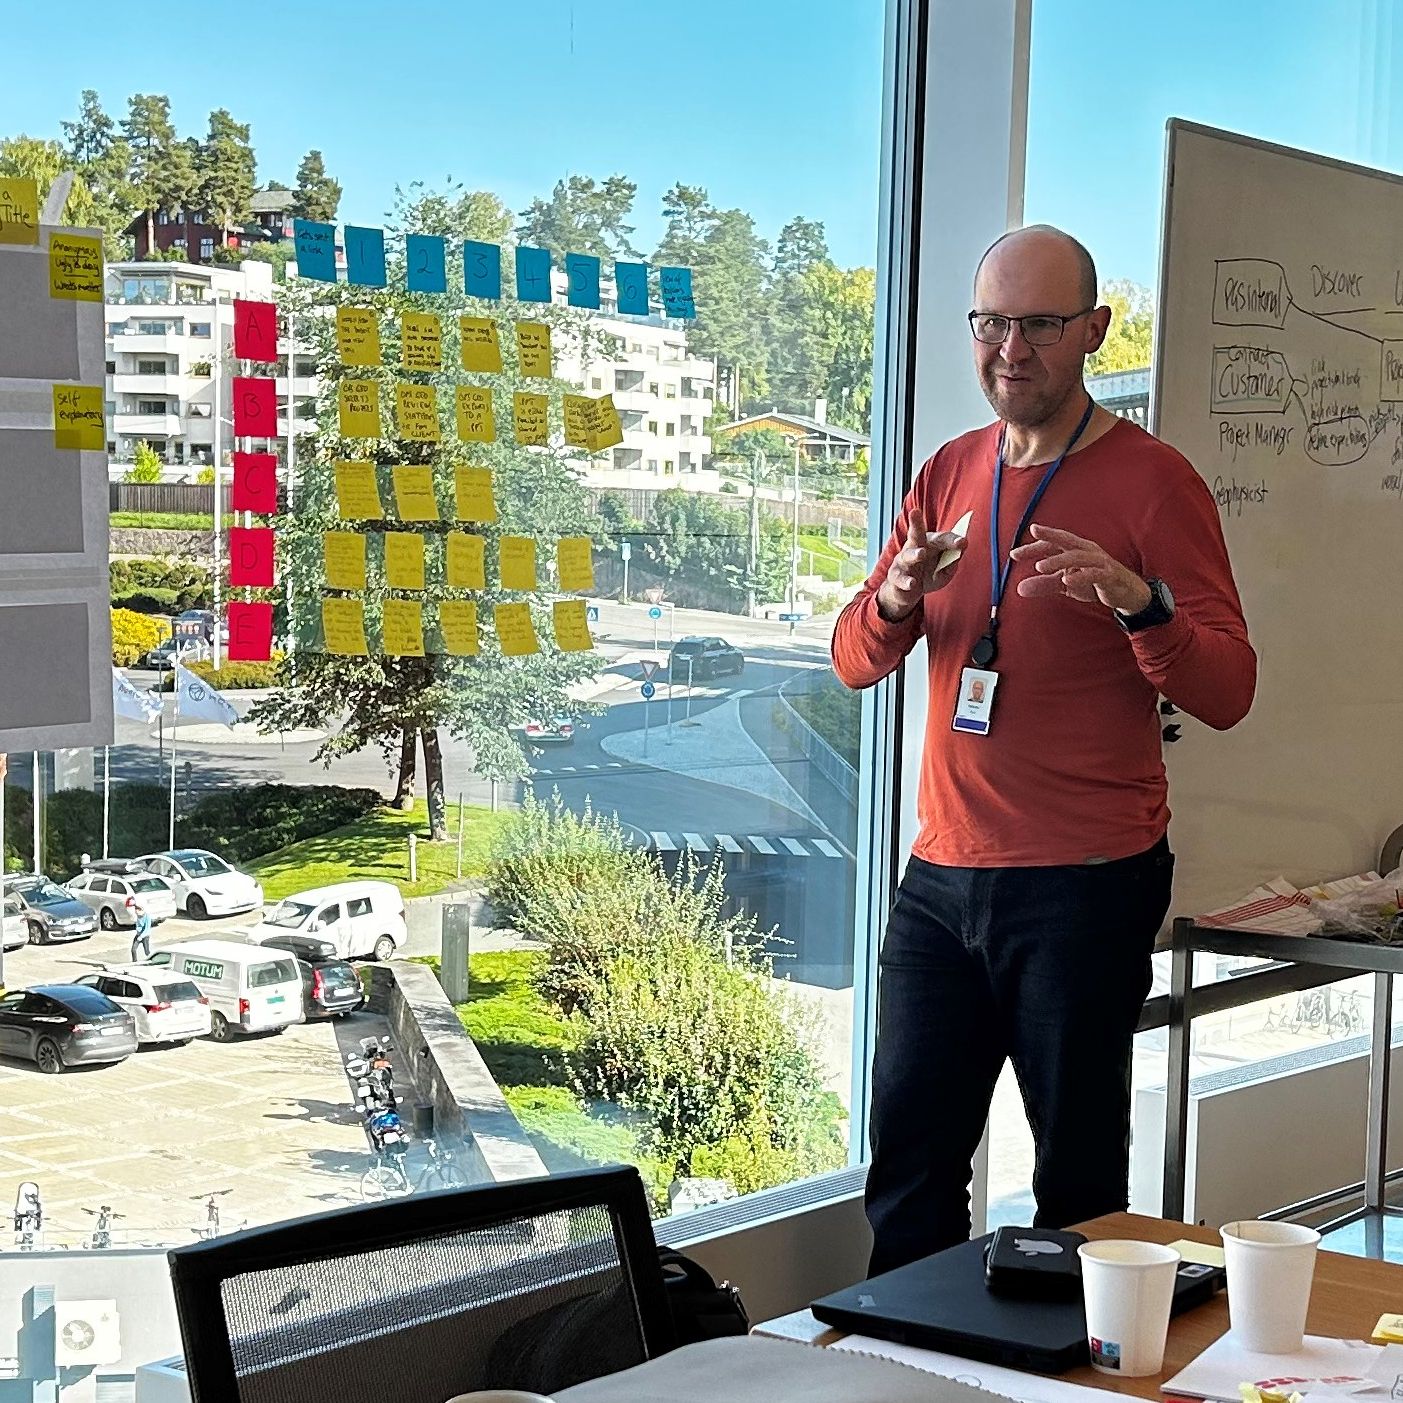
Design Sprint: A Faster Way Forward
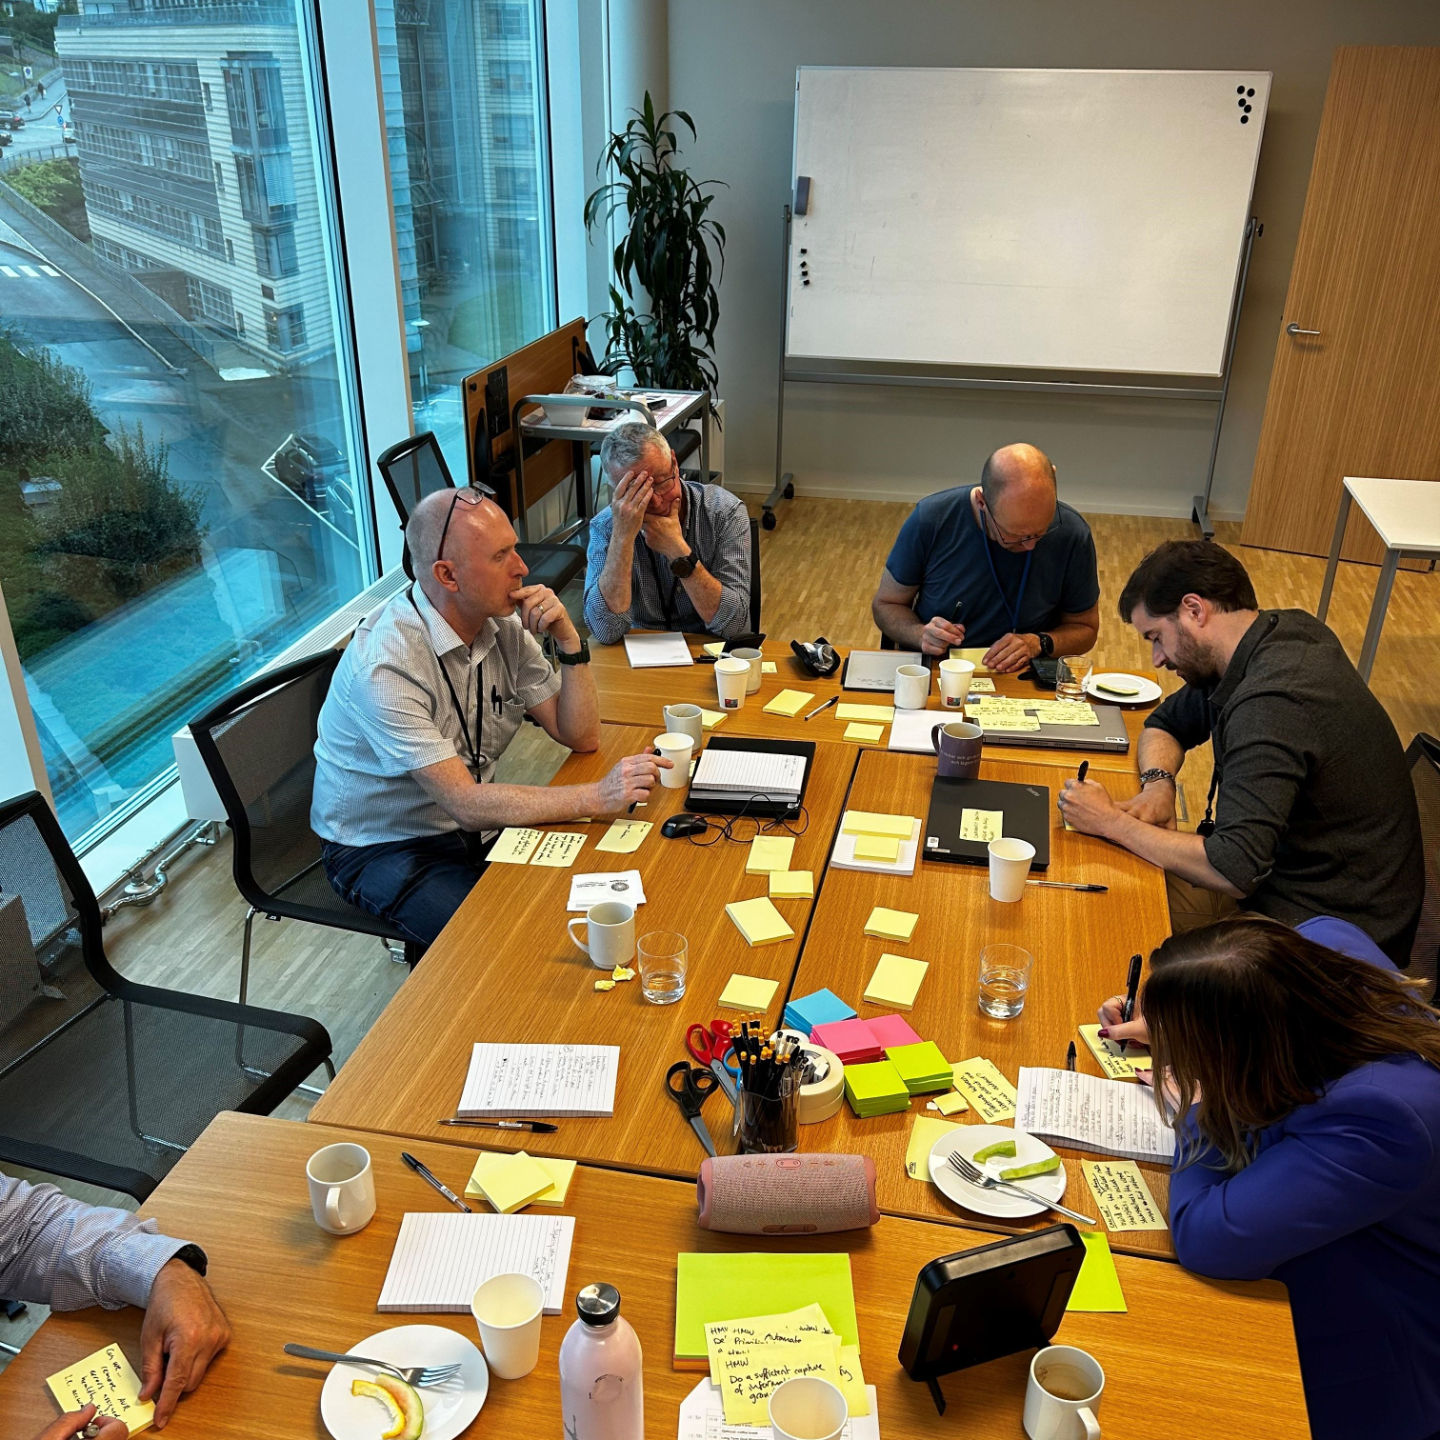
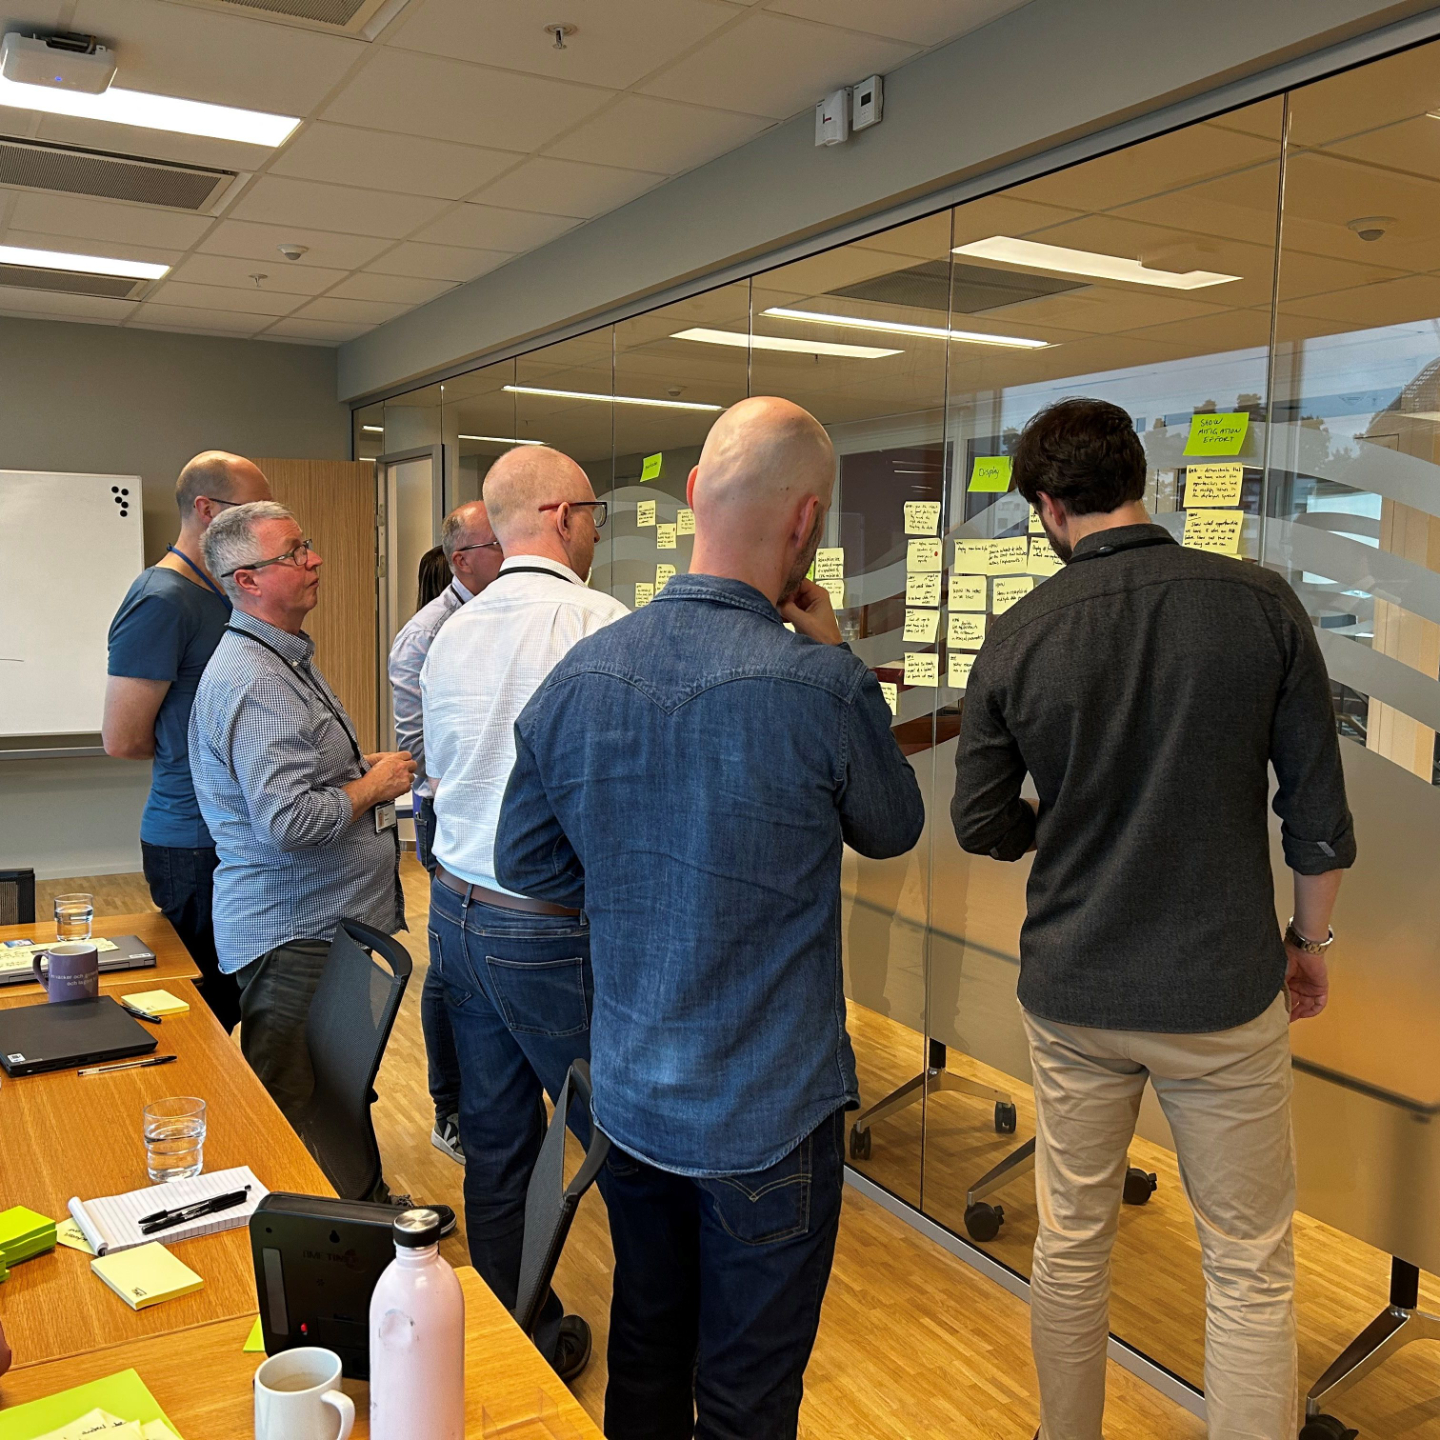
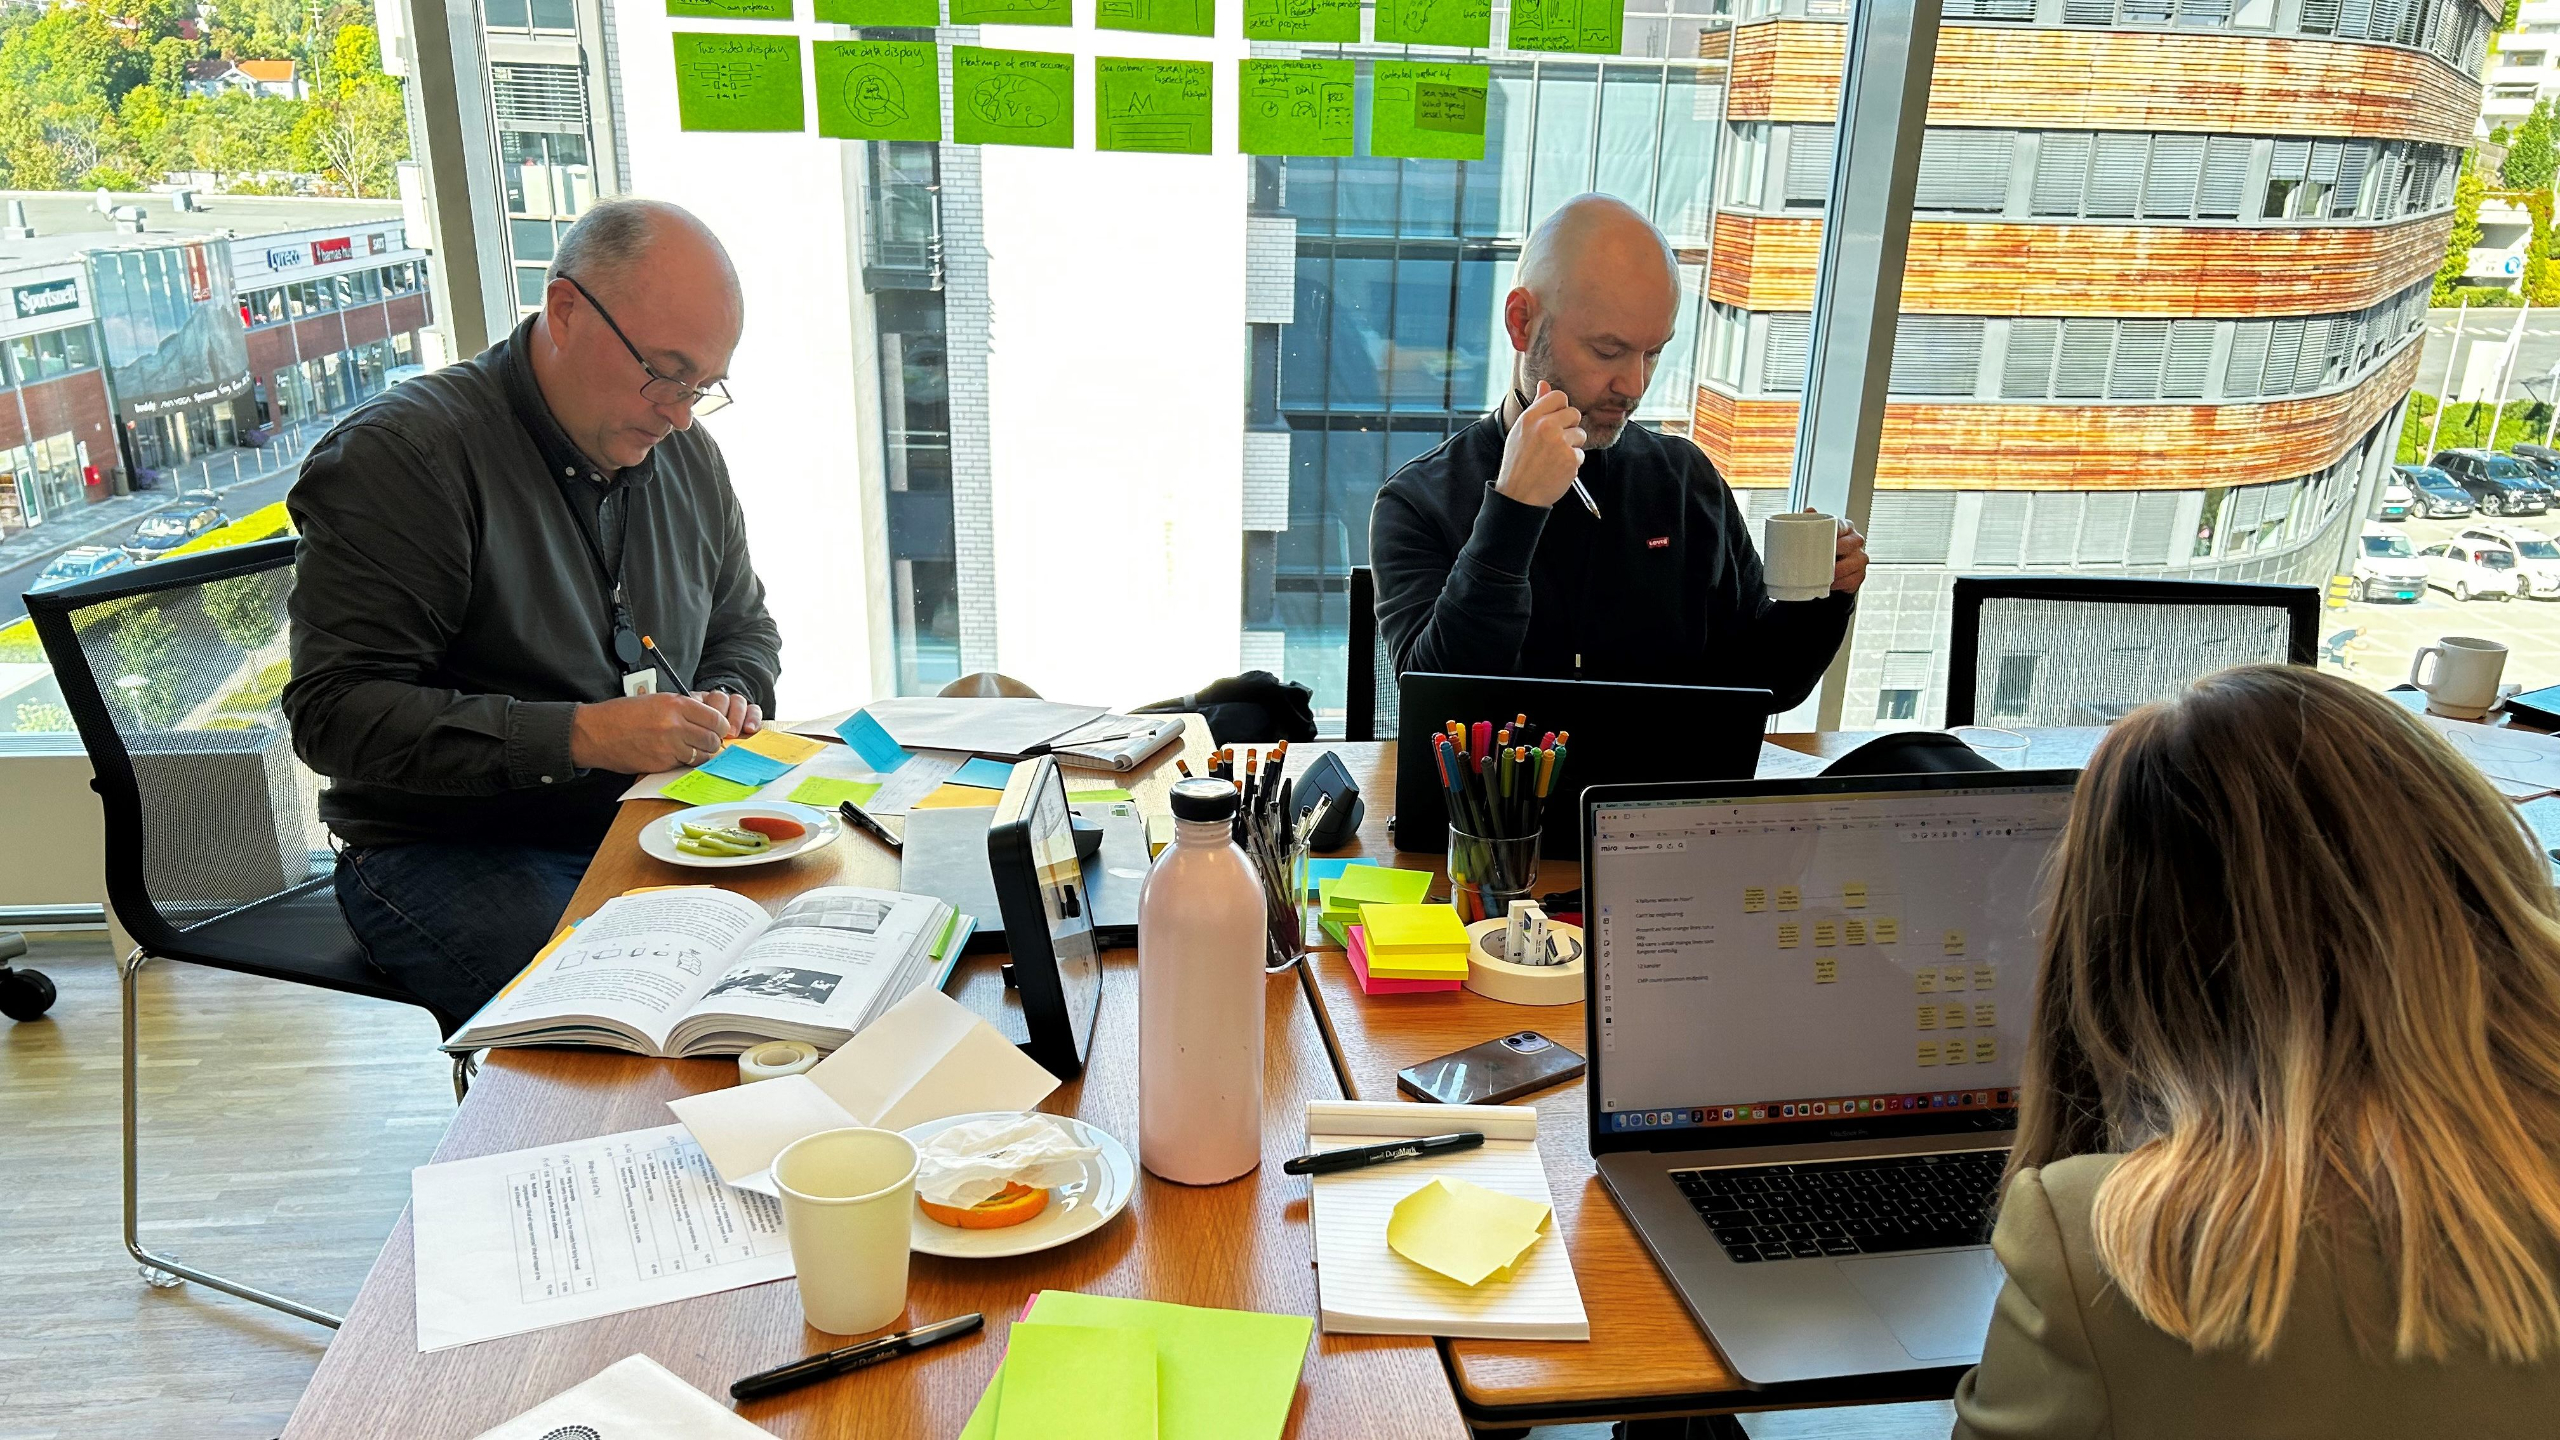
We organized and ran a four-day design sprint. We mapped out a team of 6 experts from various departments that could represent a range of competencies and angles of interest and gathered them in a large meeting room. Ed explained his problem and I guided the team through a focused series of design-sprint exercises to break the problem open and reimagine the workflow.
Four Days of Alignment, Ideas, and Making
Day 1 - Build a common understanding of the problem, and generate solution ideas.
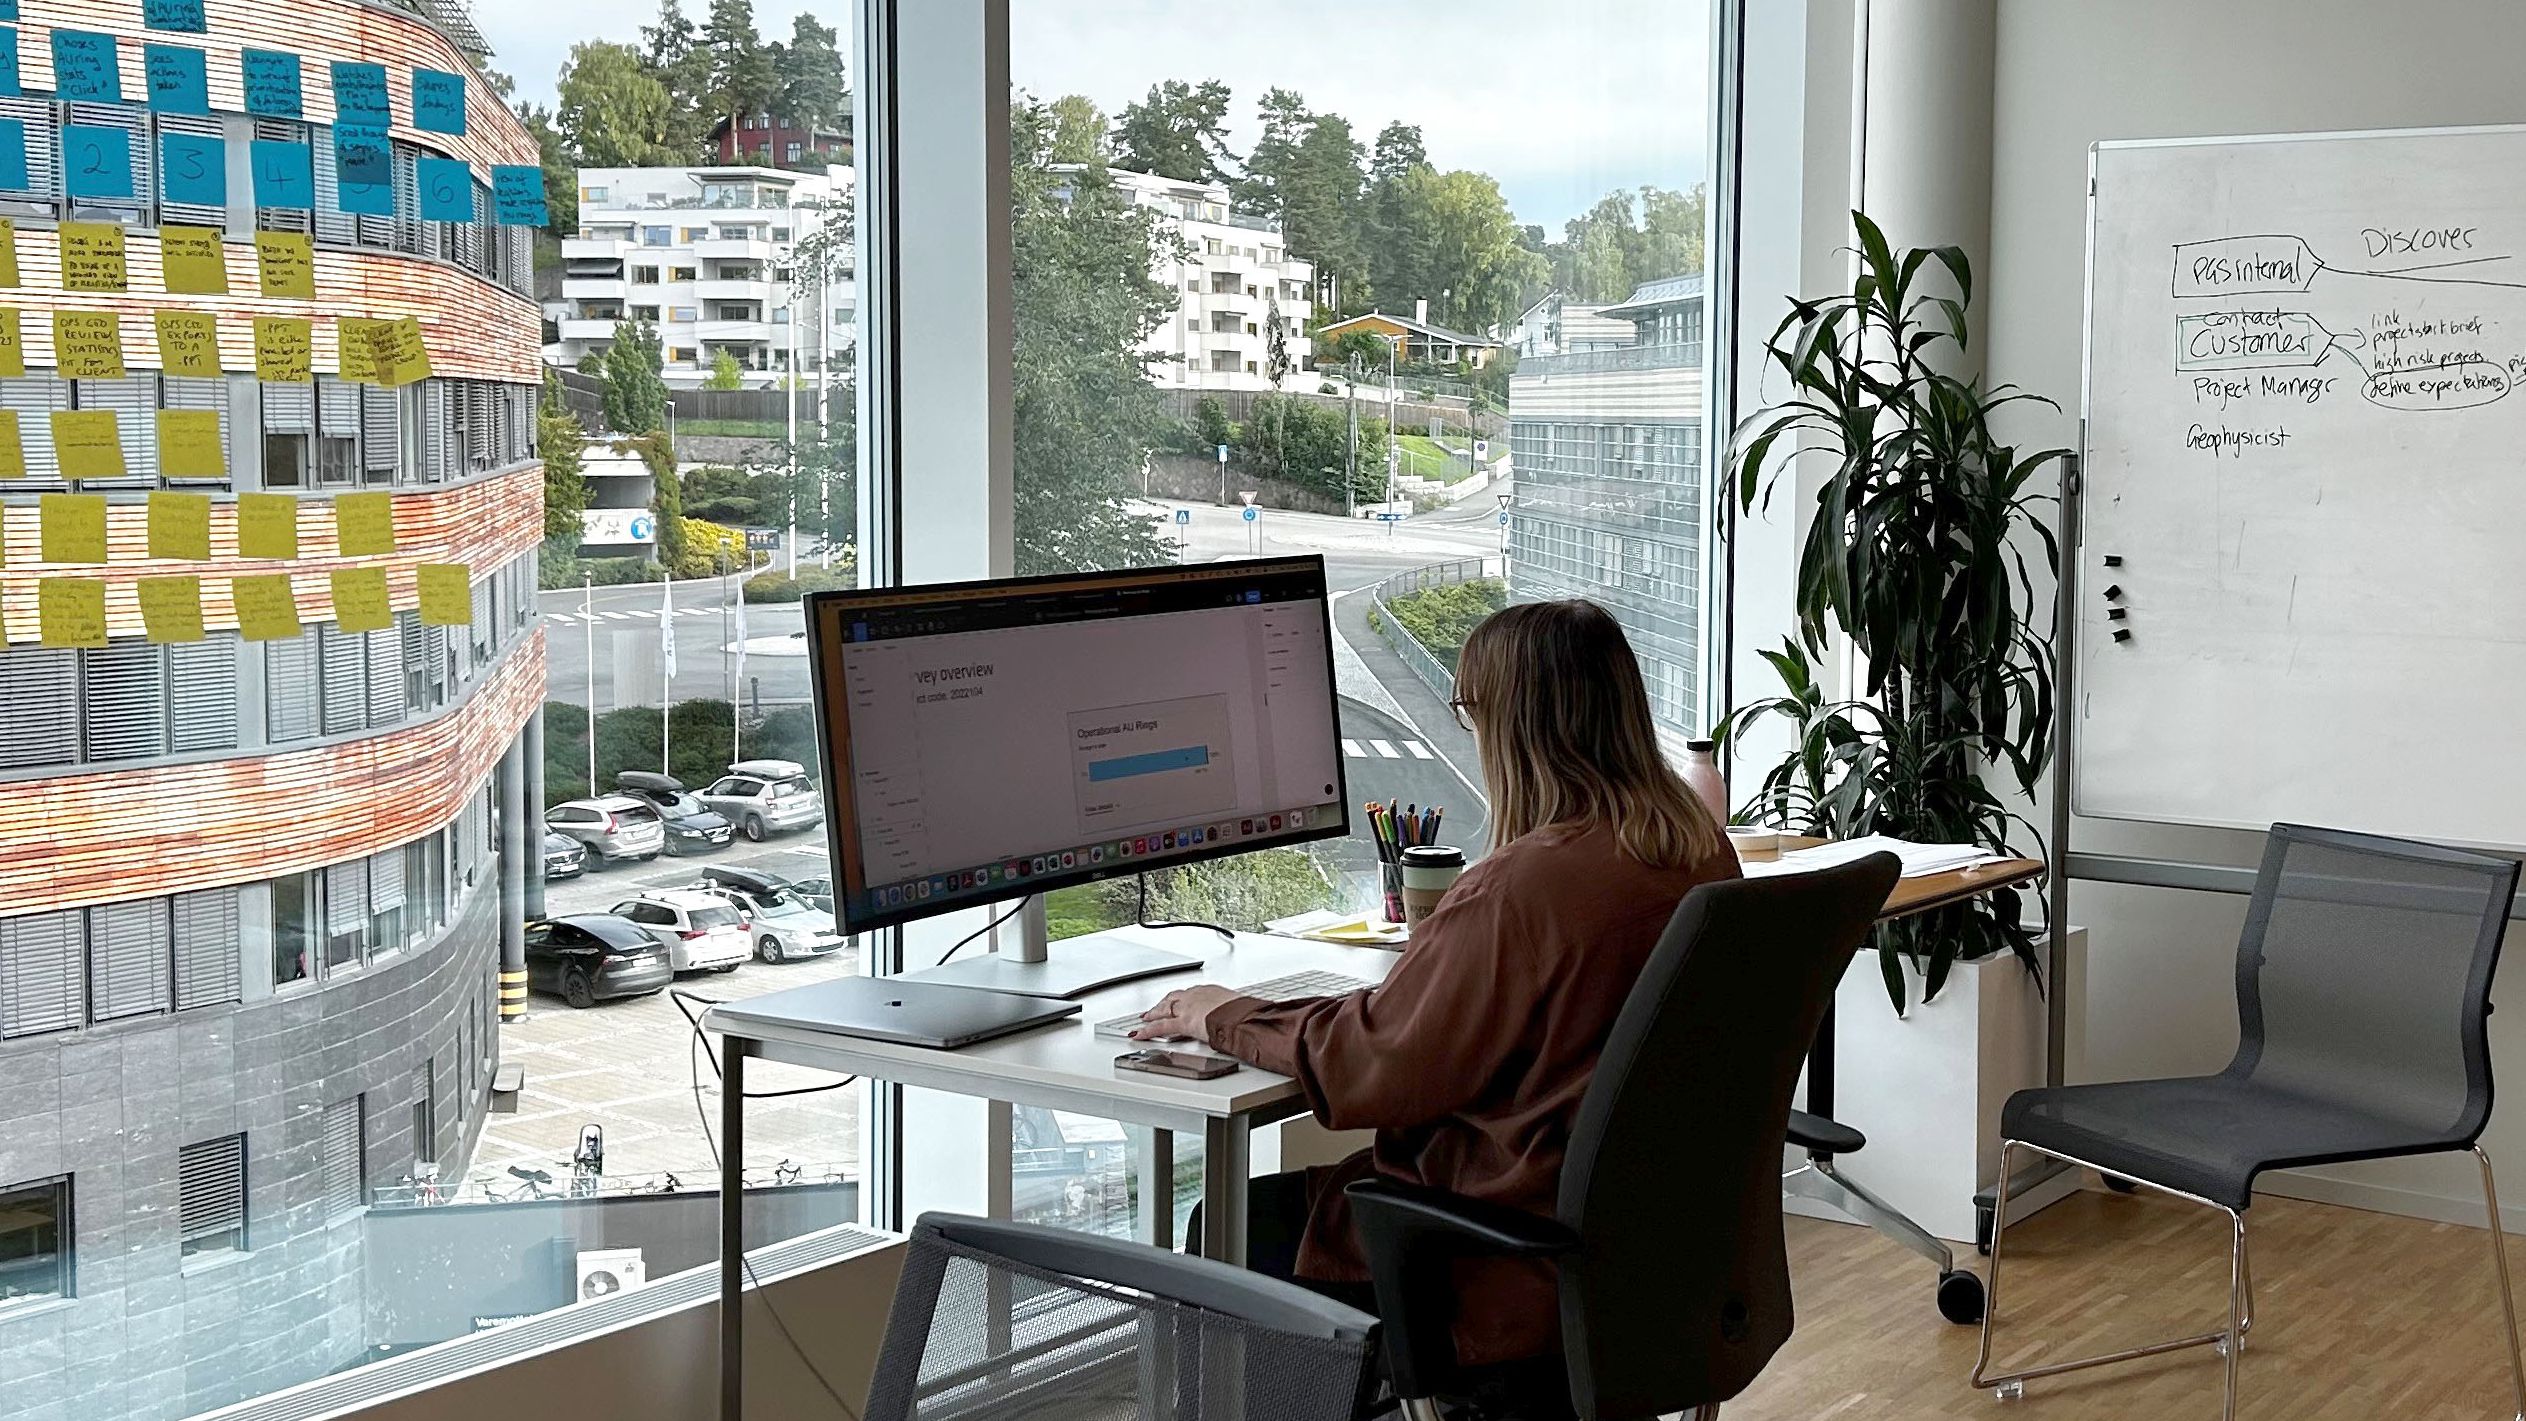
Day 2 - Decide on an idea to test and create a storyboard blueprint.
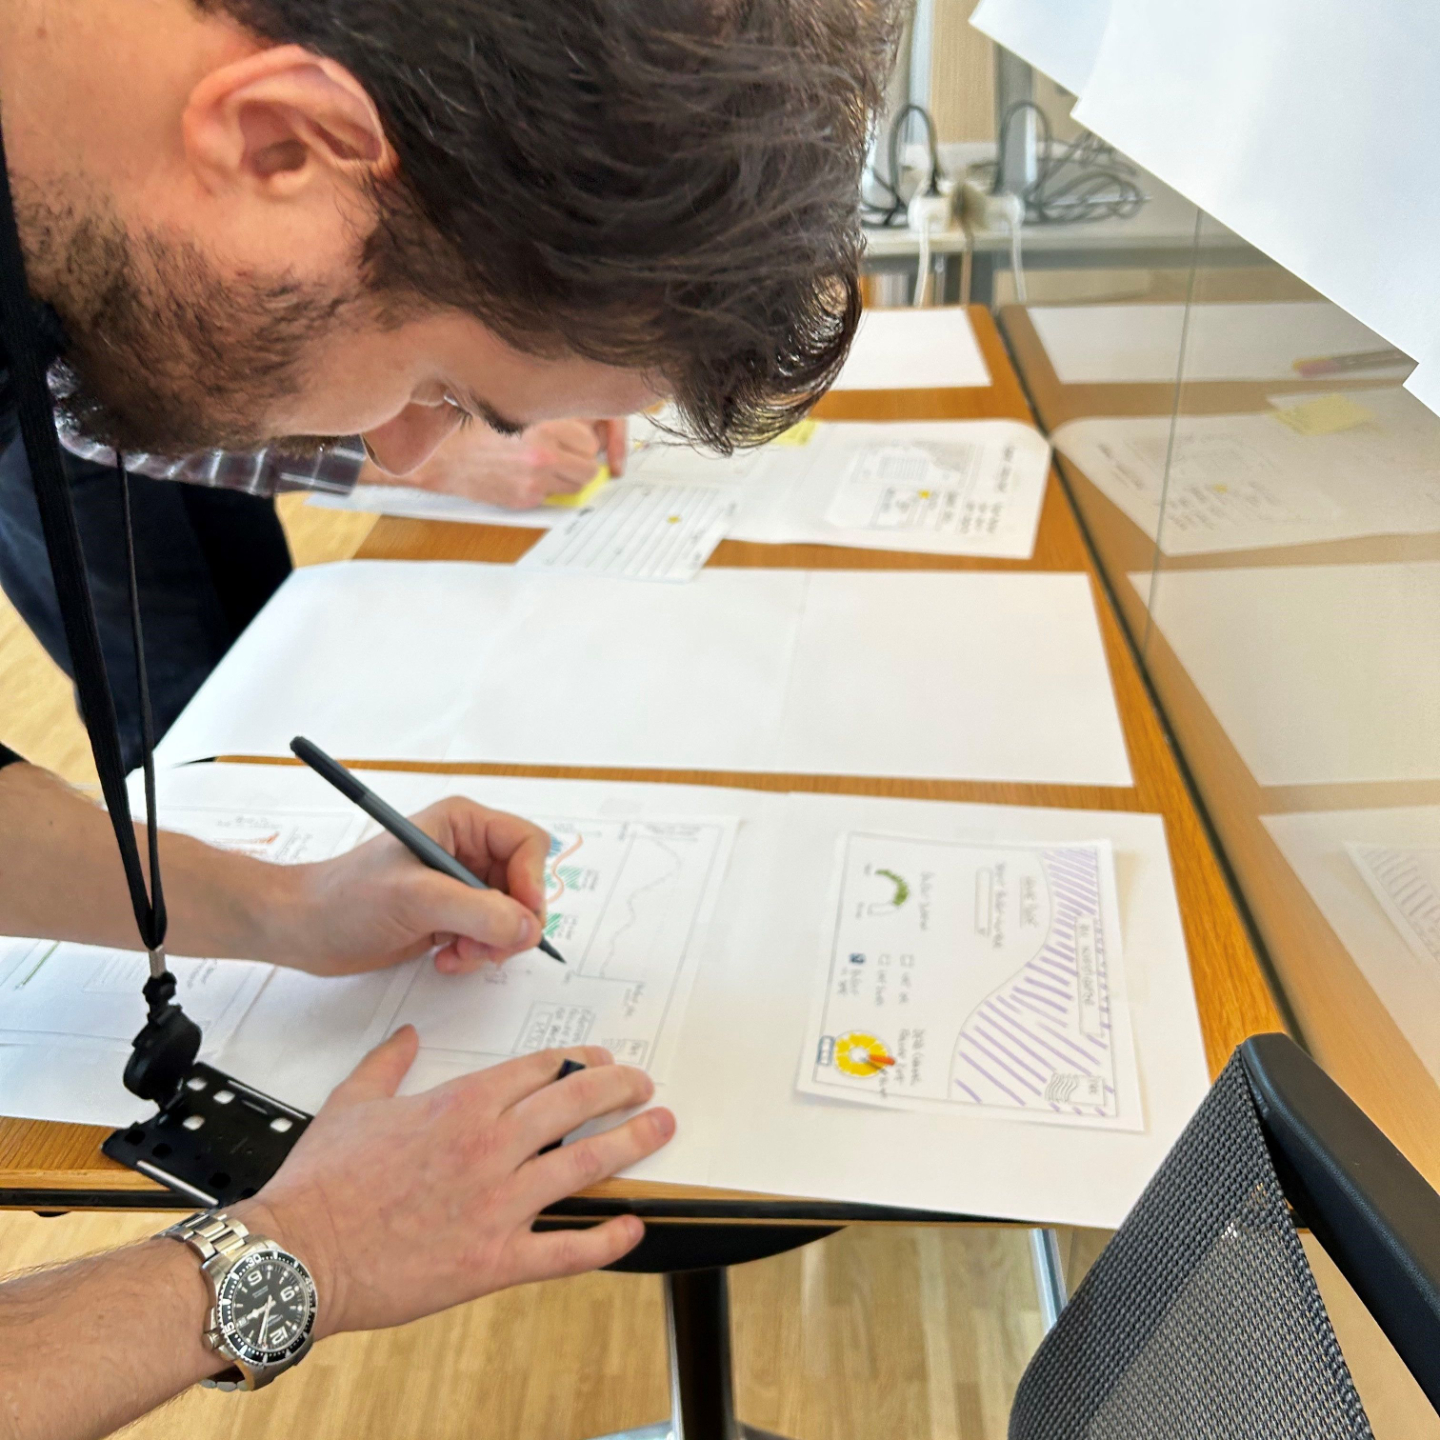
Day 3 - Build a working prototype.
Day 4 - User testing interviews and way forward.
The design-sprint format gave us a controlled, fast-paced way to align experts, test assumptions, and validate a solution in days rather than months.
By the end of day two we had a completely new perspective, a concrete storyboard blueprint, and were ready to build a working prototype. On the third day the UX designer built the prototype in Figma while a small team worked on booking meetings with users. On the fourth day we tested the prototype with five colleagues that represented either roles close to the client or that they were clients previously.
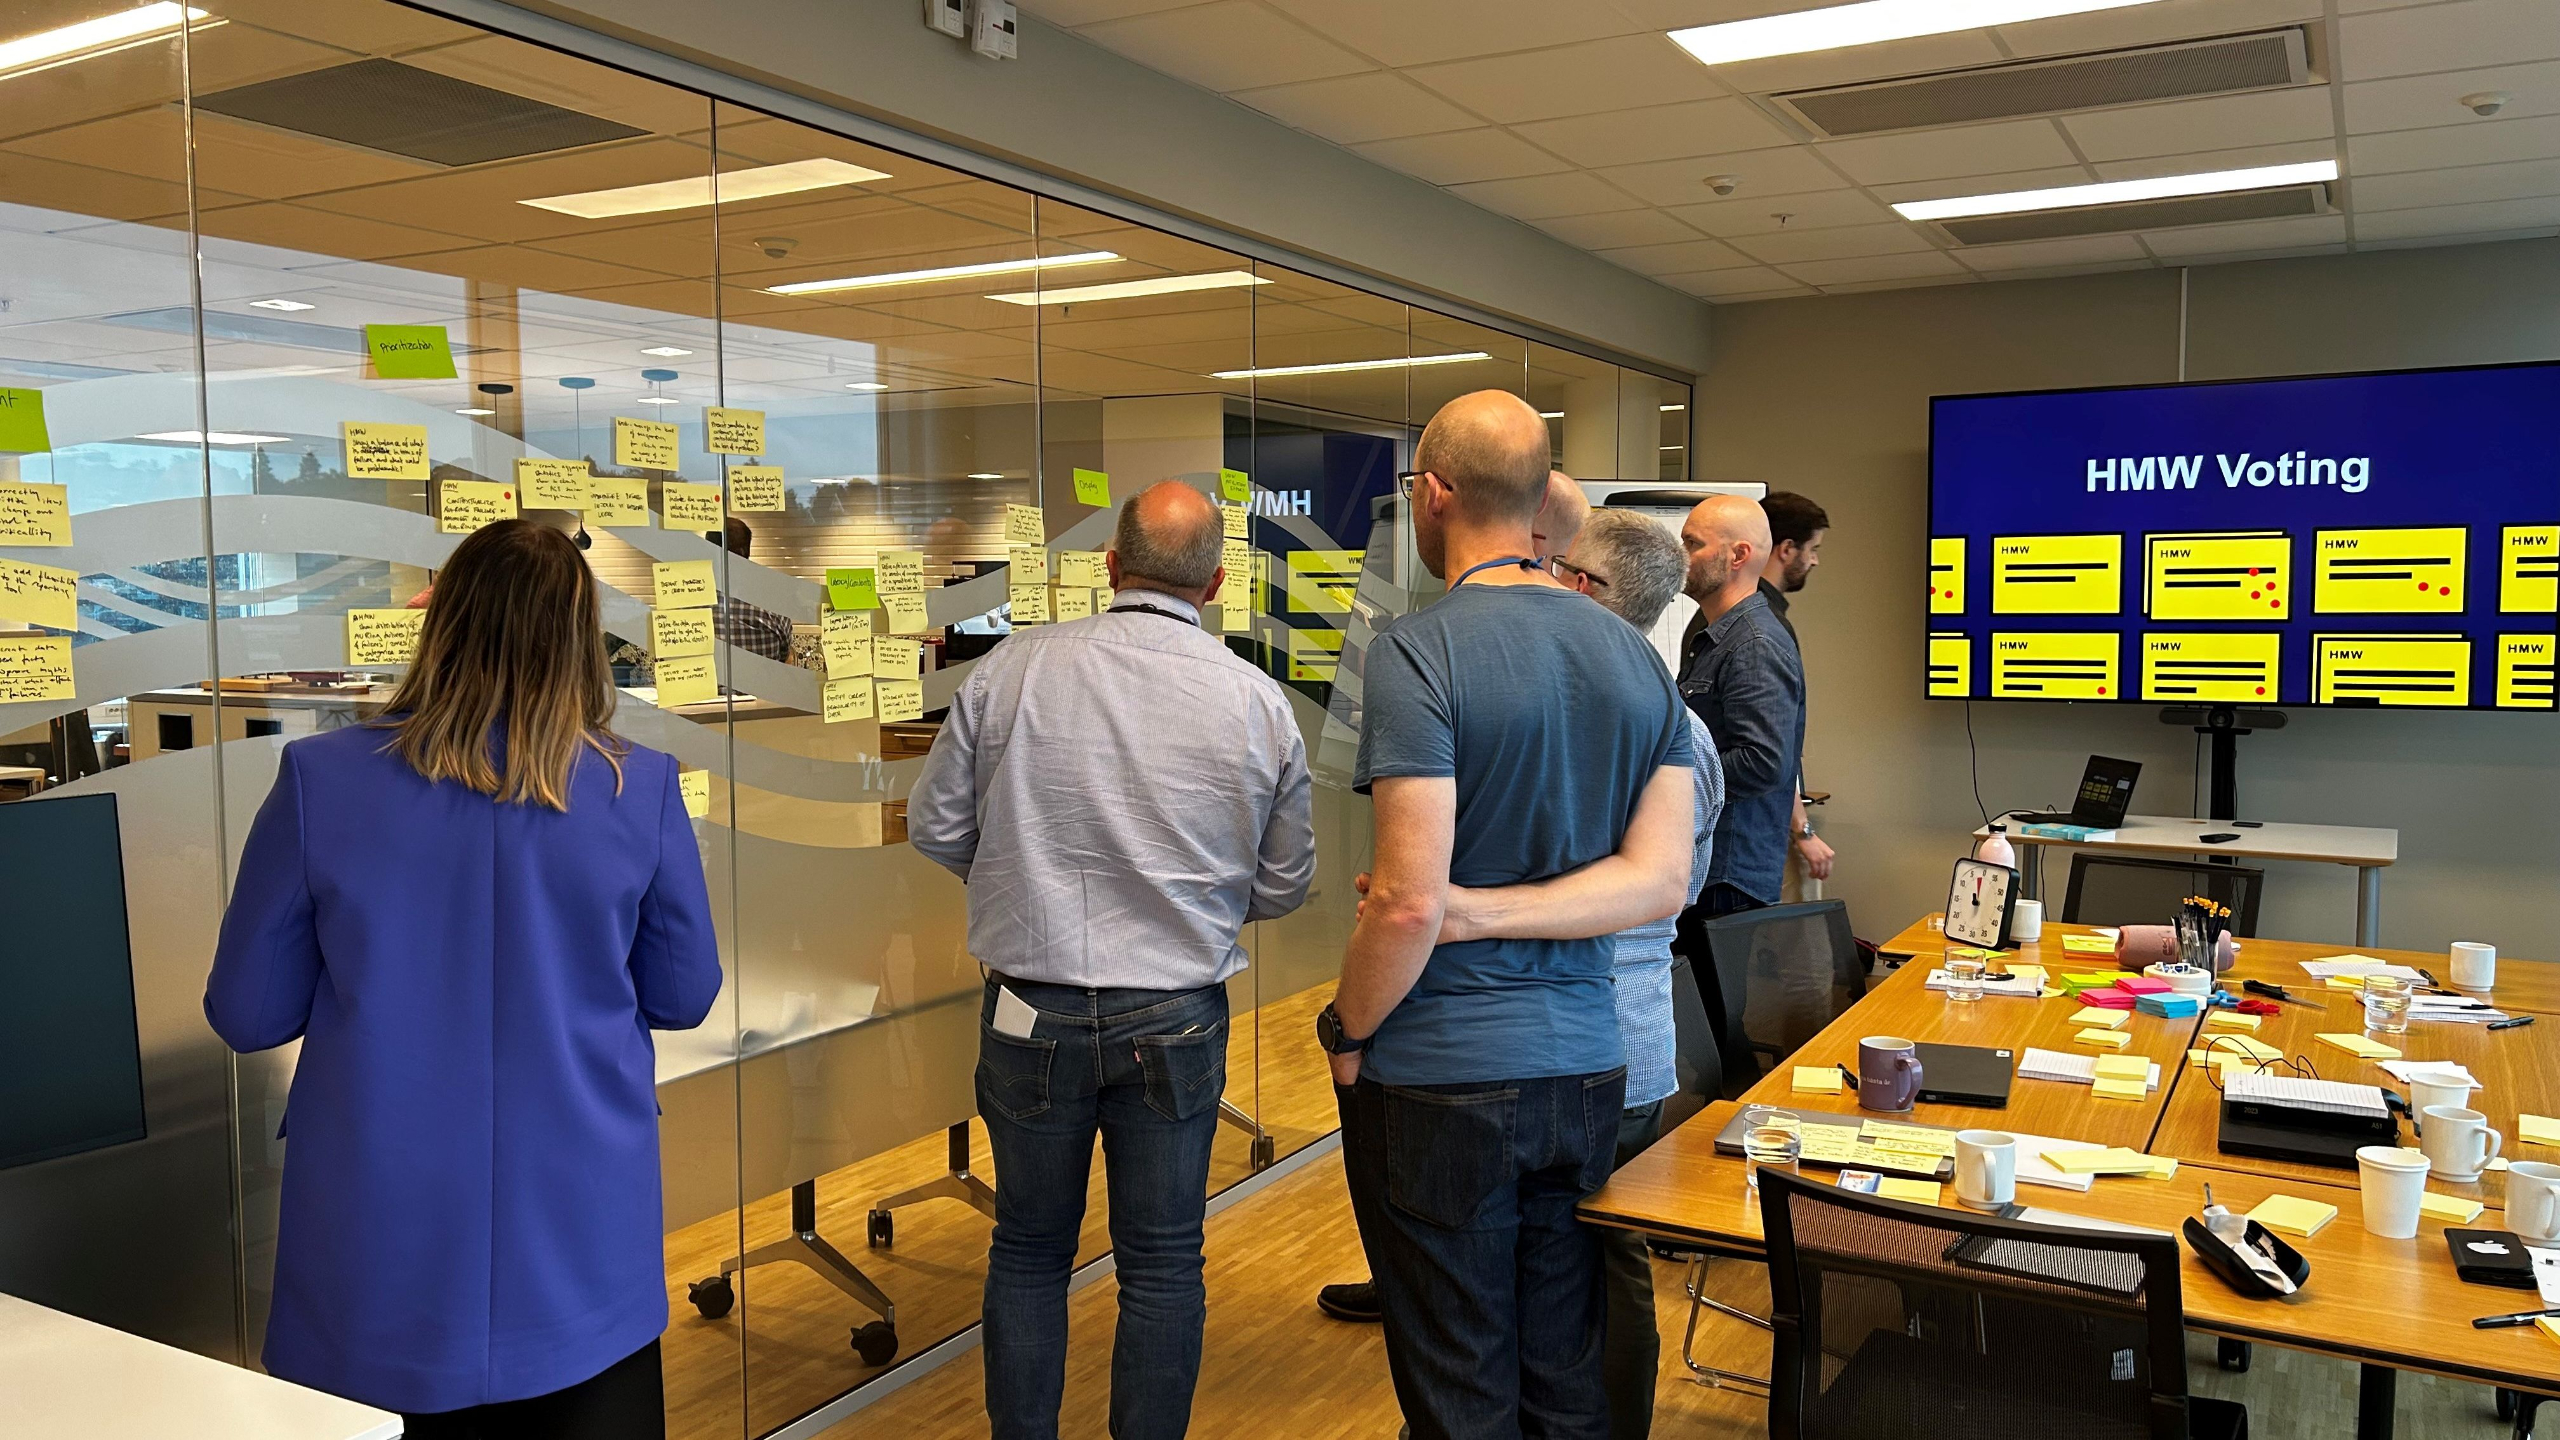
Wrapping up the sprint with our conclusions we celebrated a huge progress and concrete actions for iterating on the prototype. User feedback confirmed the approach was dramatically clearer and more intuitive than the existing slide-based workflow. We had a backlog of improvement tweaks for the UX designer and a validated prototype ready for backend development.


A New Way to See the Data
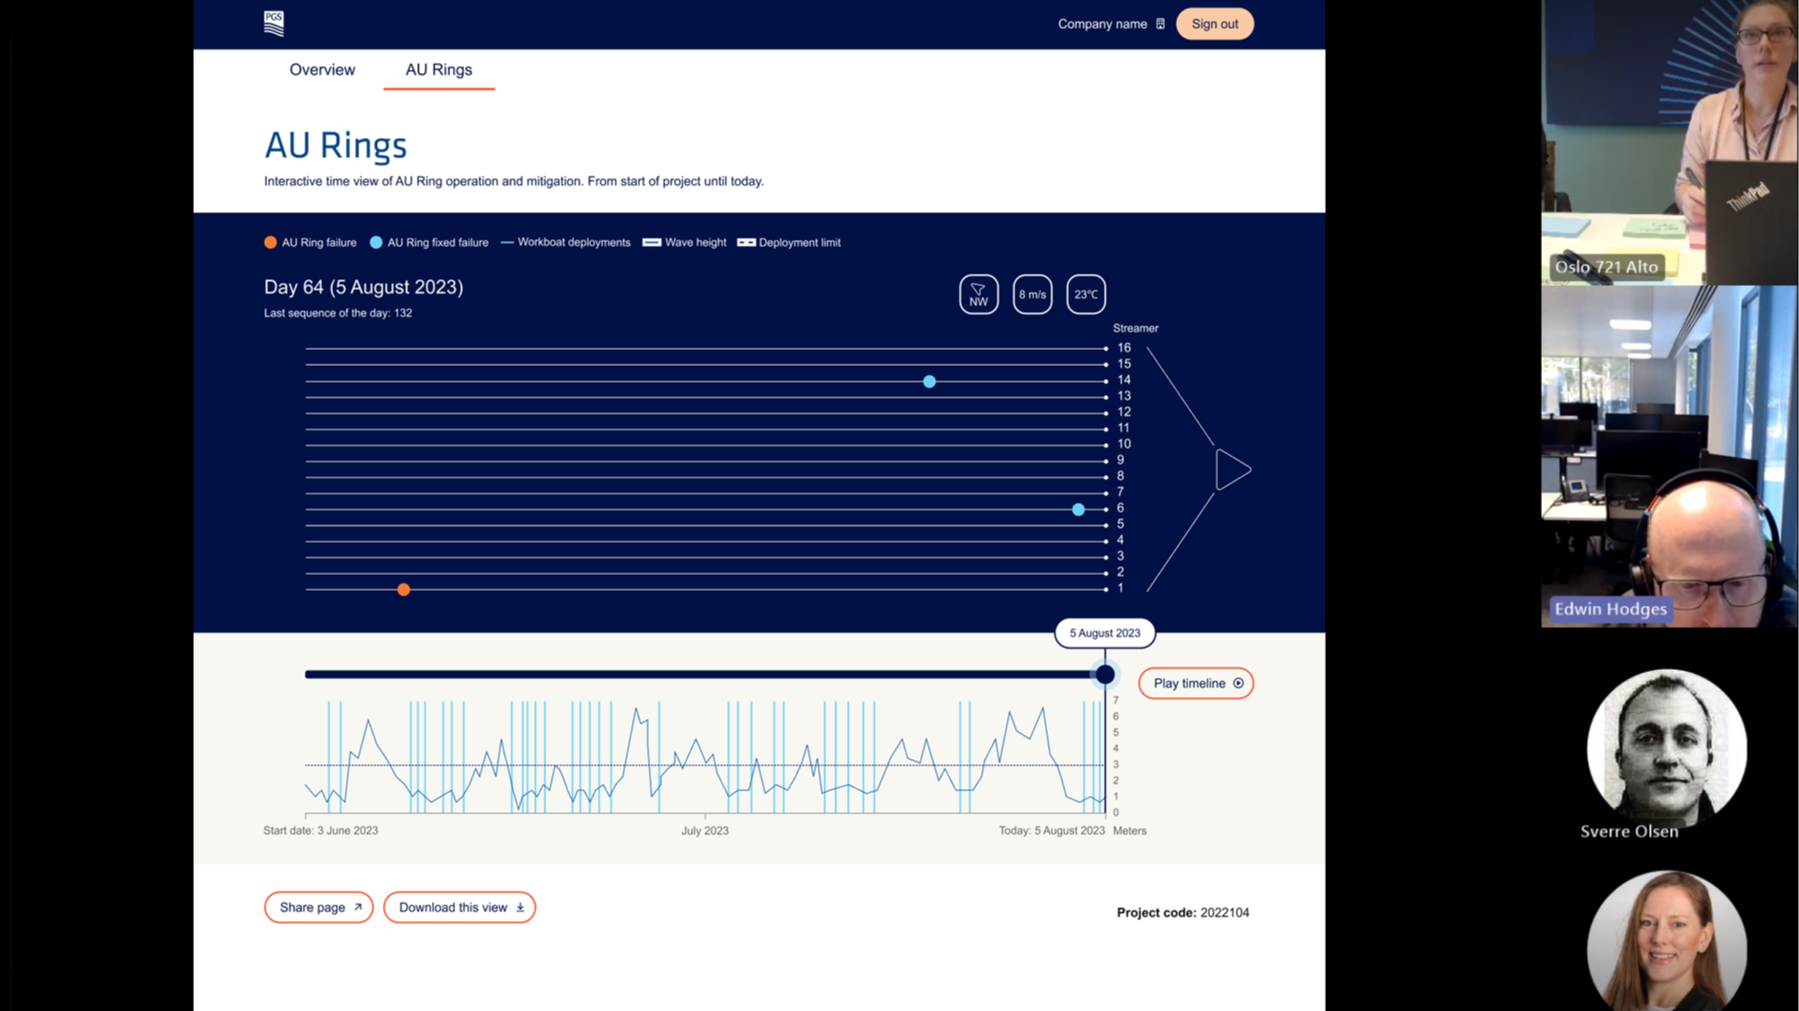
The prototype itself was a dramatically different solution to the current way of working. One of the key ideas was to use a timeline player functionality. This meant that Ed and his team would be able to share this one interface view with the client and simply skip through, like a YouTube video, pausing to investigate, rather than needing to create 80-100 slides. There would be no copy and pasting, and no need for all that time sorting through and building the case every time.
Real-World Results
The prototype went into production shortly after the sprint. Developed in React and connected to live data, it transformed the reporting process into a single, interactive timeline the team and client can explore together. No more 100-slide decks, no more copy-and-paste marathons. It has saved Ed’s team significant time and shifted conversations from explanation to collaboration, strengthening trust and enabling more meaningful, pragmatic decision-making.
Testimonials
"Eager to try out this approach, although with healthy skepticism. I was pleasantly surprised by the innovative appearance of the prototype. It seems a lot can be achieved in a short time."
Ed Hodges Vice President, Operations Geophysics

“I came up with ideas I have never thought about before!”
Tryggve Sørensen Software Engineering Advisor
"Amazing to get 6 people in the room without any disagreement for 4 days! The process was leading us forward all the time.”
Malcolm Lea, Technical Architect
If this feels familar
If you’re dealing with similar questions around launching a new product, service or process, you’re welcome to book a conversation with me.
This is not a sales call.
It’s a space to think things through together.

Kat Mather
Leadership Partner
Hi, I’m Kat, founder of Design Linking. I partner with leaders navigating change and ambiguity, helping their teams build clarity, trust, and accountable ways of working that deliver real results through human-centred design and participatory experiences.
